Sentiment analysis is a fantastic tool for summarising customer feedback. But wouldn’t it be great to know more detail as to WHY they are delighted or dissatisfied? By leveraging the NLTK library and Naive Bayes algorithm, we isolate key words that give us a clue into WHY customers are satisfied or deeply disatisfied with a particular product. The idea is that these words will provide us actionable insights to augment what is working to optimise profit or address the most pressing sources of frustration to prevent churn.
I will walk us through the whole process from data loading, data cleansing, tokenizing to ultimately drawing up the final visualisations and insights for a hypthetical context so that you can apply these techniques in your own data.
First of all, the data is taken from a music website where users write extensive reviews on what they love and hate about each album/song. Below is a sample of one row:
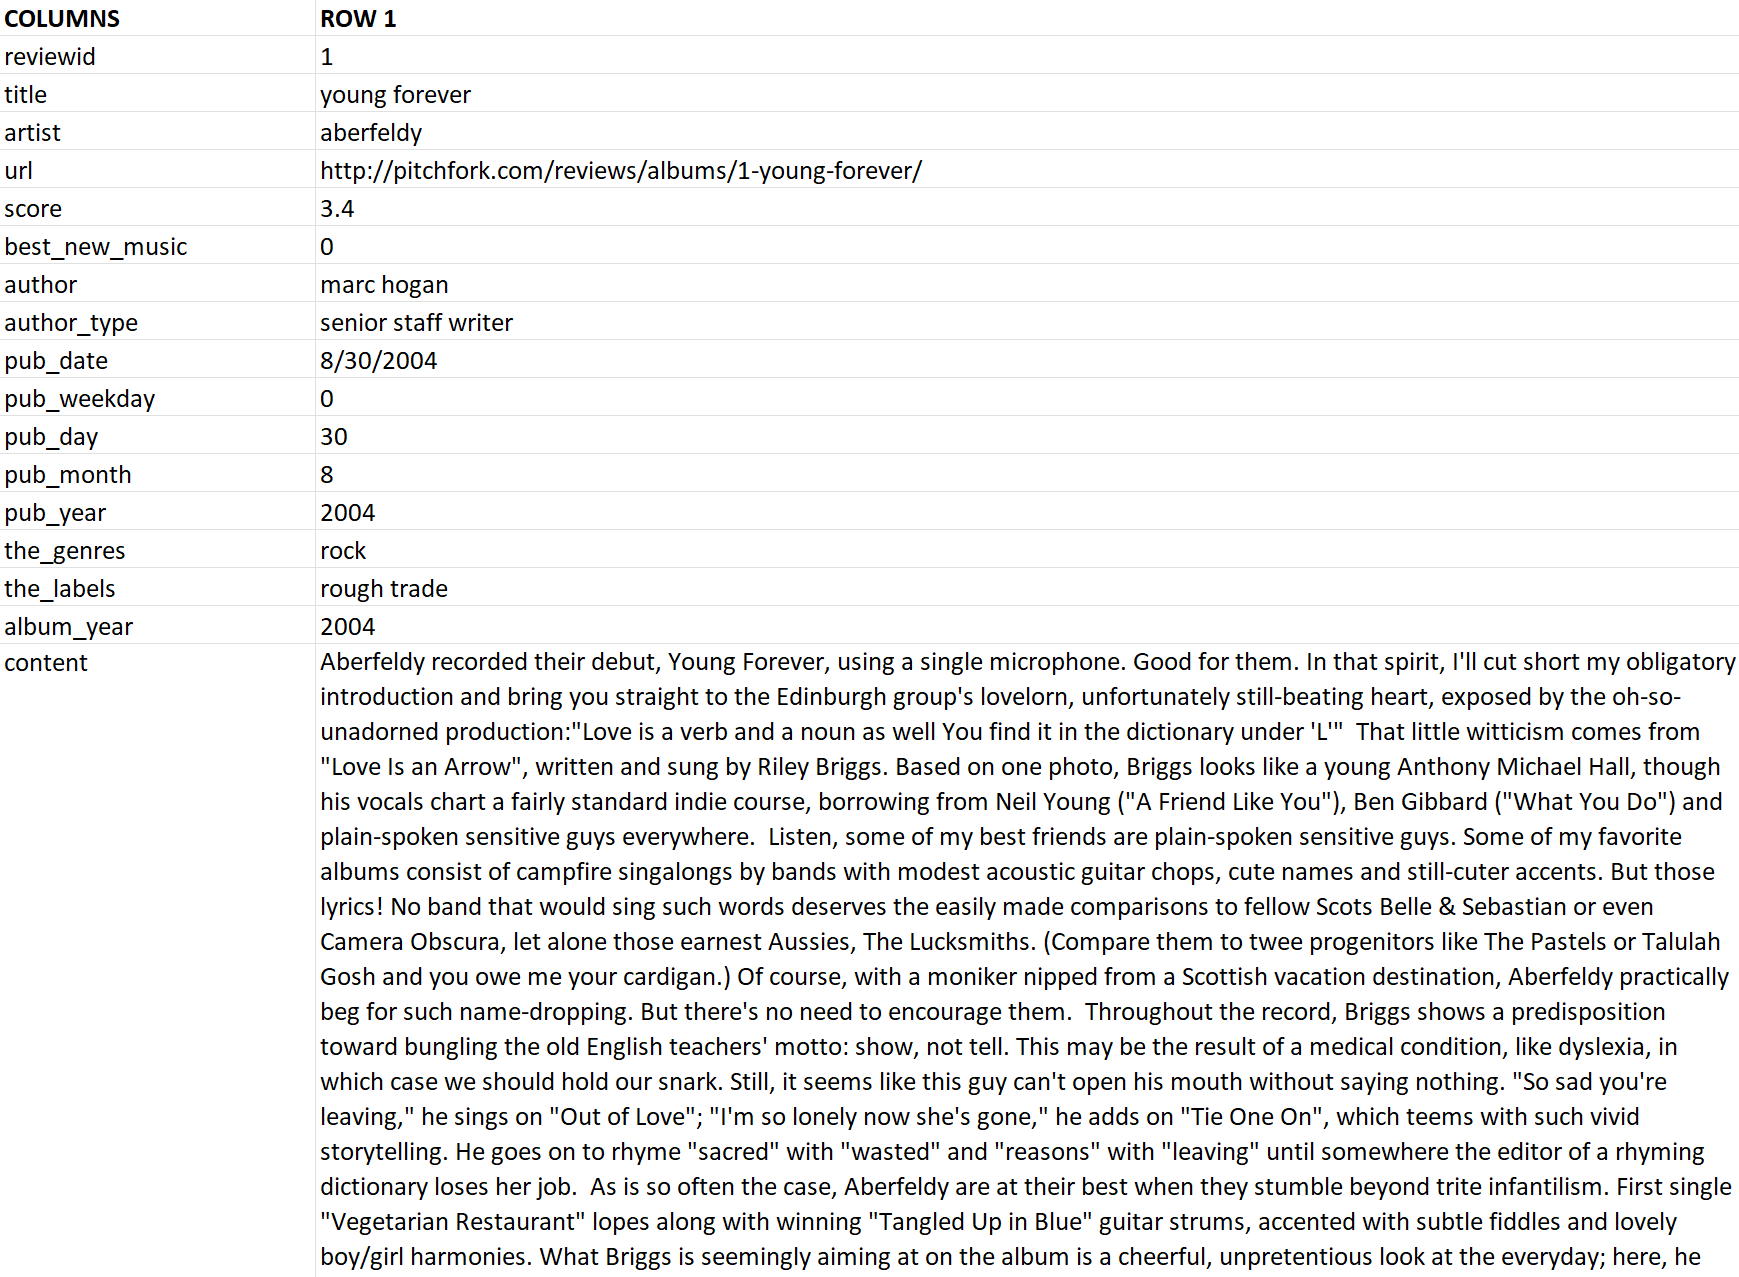
As you can see, each review is rich with detail and nuances for us to glean insight but each review would take at least 5 minutes to read and when we compound this by thousands or millions, it becomes untenable to find helpful patterns in the data.
A good first step in my mind was to start classifying the reviews between positive, neutral and negative for us to start organising insight into “What is working that we could further optimize?” vs “Why do they dislike the product (churn reason)?”
I can walk you thorugh the code details on my Deepnote Project. Deepnote is the most fantastic tool that combines the power of SQL and Python to give an entire cloud-based pipeline in one place!:
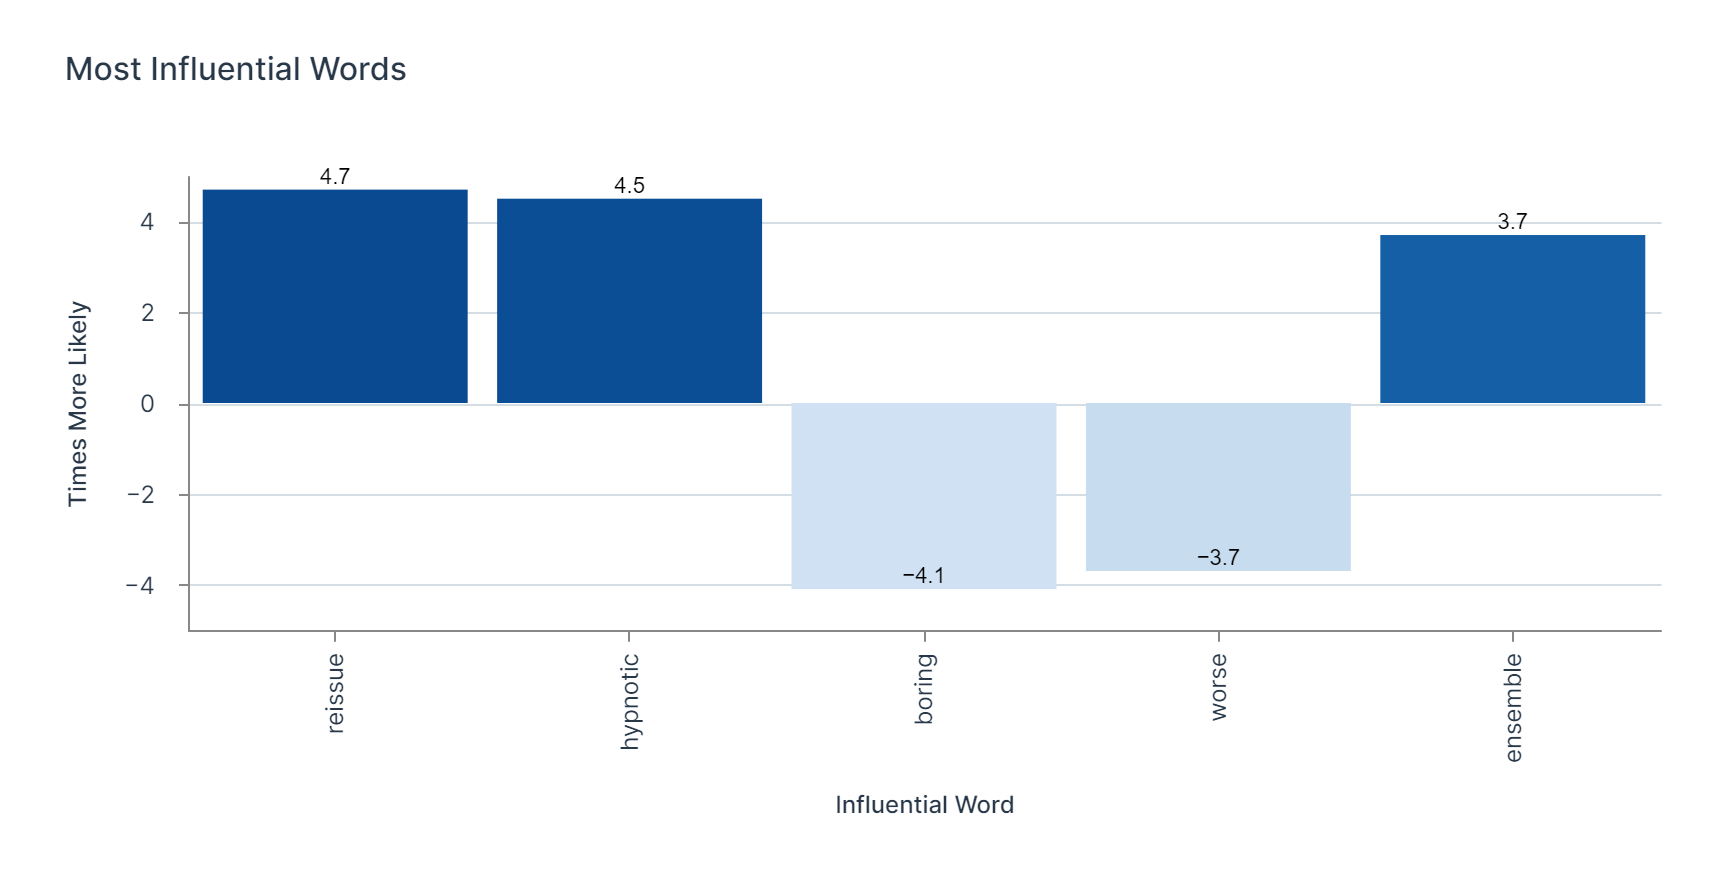
Below was a rough first cut of the findings that resulted from the Naive Bayes classifier:
Thanks for reading! Please provide any feedback that could help me improve :)

Jeanie Oh
If you enjoyed this post, please leave a comment below to let me know. Also, I welcome any feedback you may have to improve. If you need help with data analytics, visualisation and or governance topics, reach out to me at contact me.